Alexa Song Listening History
R Shiny, IFTTT, Google Sheets
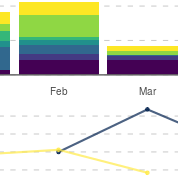
This R Shiny dashboard displays song data played via Amazon Alexa. Once Alexa plays a song, an IFTTT application moves the song data to a Google Sheet. The dashboard contains four tabs: Frequency Plot, Year to Year Popularity, Top Songs Played, and About. In the Frequency Plot tab, the user can group plots based on four different time units: Day, Week, Month, and Day of Week. The Year to Year Popularity tab contains a bump chart that the user can choose to display the top five most popular Artists or Albums played. The dashboard user can filter the entire data set based on a date range.
Hierarchical Clustering the 32 NFL Teams
R Markdown, Carto
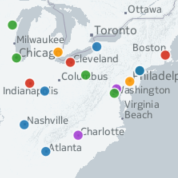
Prior to the 2016 NFL season, I grouped all 32 NFL teams with hierarchical clustering to find shared traits among teams and distinctions between each group of teams. Most of the data in the analysis is from pro-football-reference.com.

Senior Colloquium: A Social and Political Geography of Bicycle Transport in Madison, WI
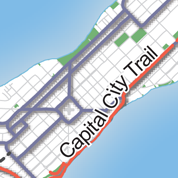
The state capital and university town of Madison, Wisconsin is home to a thriving bicycle culture. The existing bicycle infrastructure landscape in Madison is the result of a network of feedback loops involving people, historical events, city policies, and processes. This paper is the culmination of a look into the impetus of Madison's bicycle culture and infrastructure.
Final Project: Madison, WI - Bike Infrastructure and Social Mobility
Esri ArcMap, Adobe Illustrator
Part advocacy and part information piece, this project presents maps and infographics detailing the benefits of bicycle transportation in Madison, WI.

Story Telling Challenge: Spending Street?
Esri ArcMap, Adobe Illustrator
During the 2012 presidential campaign, a candidate suggested that federal subsidies for PBS contributed to the federal government's debt to China and that these subsidies were not critical enough to add to any foreign debt. Spending Street? identifies how much federal money is truly spent on PBS and describes the domestic and international benefits of public broadcasting programming.
Final Project: Flooding in The Netherlands
Esri ArcMap, Adobe Illustrator
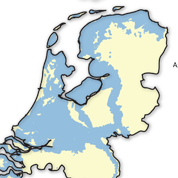
Approximately 26% of The Netherlands sits below sea level and roughly 1/3 of the Dutch population resides in a flood-prone area. Treading Water overviews the potential fallout if Dutch water management projects were to fail.